Welcome to RobarGuns' Firearm Sales Index. This database shows the number of firearms sold in the United States since 2017, among other statistics about the sale of firearms across the country.
In the year 2020, there were a total of 18,924,584 firearms sold in the United States. That number increased by 47.78% from the previous year. The state with the highest number of firearms sold in 2020 was Illinois, with 1,811,581 firearms sold, followed by Texas with 1,339,362 units, and Indiana with 1,114,898 total firearms sold. In terms of growth, the states with the highest four-year growth rates were Illinois, Utah, and Indiana, with 398.88%, 369.21% and 143.24%, respectively.
2020: A Blowout Record Year for Firearm Sales
In 2020, the United States saw an increase in the sale of firearms unlike any other time in history. The perfect storm of historic events that occurred in 2020 ignited a huge movement and sense or urgency to purchase firearms all across the country. The unprecedented coronavirus pandemic, heightened racial tensions and protests surrounding police brutality, a fiercely politically divided nation, and an intense presidential campaign all contributed to a drastic increase in firearms sales in 2020—so much so, that the surge completely overwhelmed the FBI's NICS, forcing some sellers to delay the finalization of sales until background checks were completed. To put it further in perspective, in March 2020, the FBI reported a record-high number of completed background checks, at 3.7 million.
The impact of these 2020 events is perfectly described by the following quote from an AP article:
“Civil unrest, rioting, looting and calls to defund police are unquestionably motivating factors of why this trend is increasing. Americans are right to be concerned for their personal safety.”
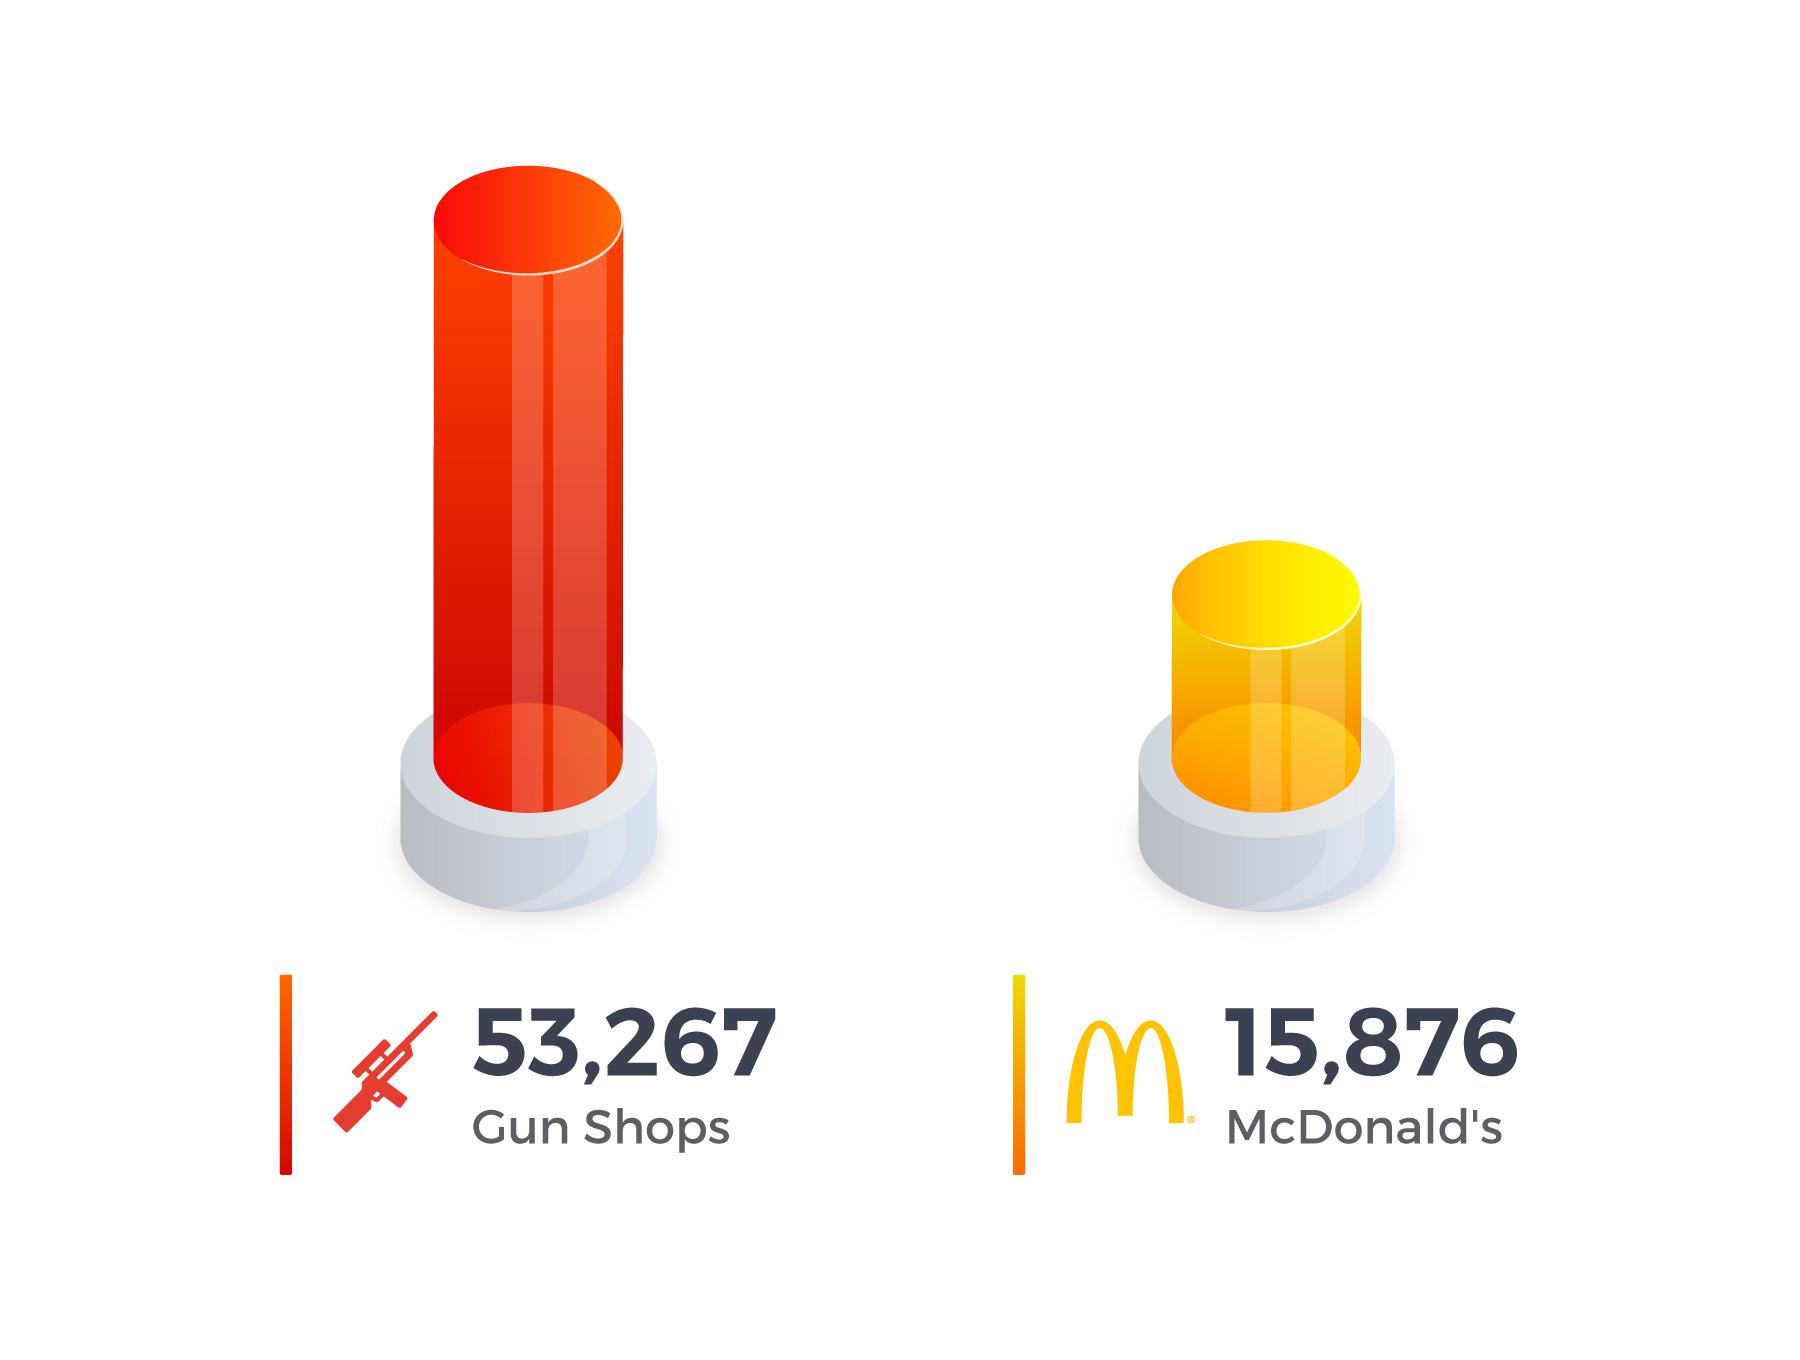
Gun Dealers Compared to McDonald's Restaurants
According to the Bureau of Firearms and Tobacco, there are a total of 53,267 licensed firearm dealers in the country. That means that there are 3.36 firearm dealers for every McDonald's restaurant in the nation. Except for our nation's capital, where there are only 5 firearm dealers compared to 84 Mcdonald's locations, every single state in the nation has more gun dealers than McDonald's restaurants.